Research & Analysis Menu

Montana - Comparative Economic Indicators: Year vs. Year Analysis of Growth and Change, 1969-2022
Montana

Introduction & Summary

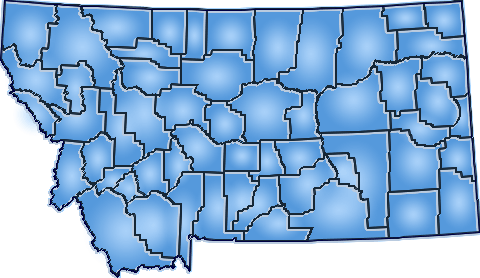
In contrast to the "Comparative Trends Analysis" reports that chronicle and compare growth and change of individual counties year-over-year, the interactive maps and tables produced by this module invite you to examine and contrast the economic status and position of each county relative to all others in terms of the following seven broad bellwether indicators:

Directions

  1. From the list above or the "Analysis Options Menu" to the right, select a desired indicator.

Additional Suggested Analysis

To compare and examine broad long-term trends of any of the 56 Montana counties, enlist use of the interactive comparative trends analysis features at your disposal by clicking on the graph below.

Population Indicies, 1969-2022

Population Indicies, 1969-2022
Brought To You By:
Copyright © 2023. Pacific Northwest Regional Economic Analysis Project (PNREAP). All Rights Reserved.

Please stay tuned...
while your request is processing:

Please wait while your request is being processed...
To offer the most comprehensive set of interactive options in support of your research, MT-REAP calculates and crunches most of the data and generates the narrative and graphic analysis on demand in response to your request.
Your request will soon be available.
Just a few more seconds....Your request has been generated and is now loading the results.